![]()
![]()
Released April 18, 2020.
The Centre of Full Employment and Equity developed the Employment Vulnerability Index (EVI) for small regions across Australia. The EVI is a collaboration between Professors William Mitchell (CofFEE) and Scott Baum (Griffith University).
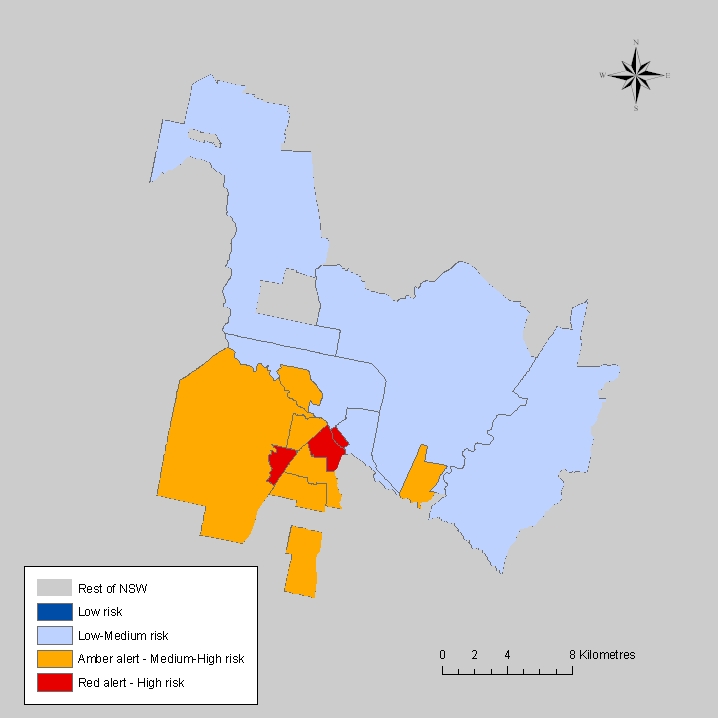
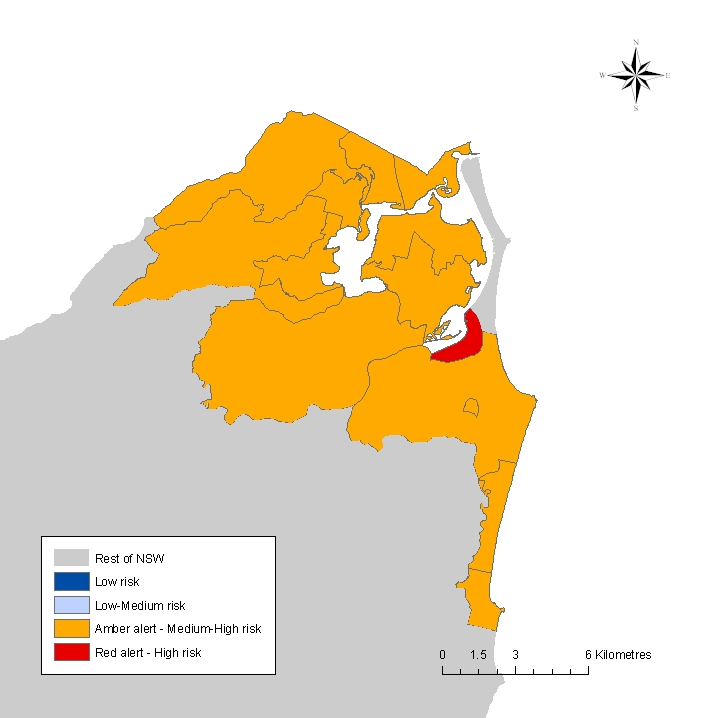
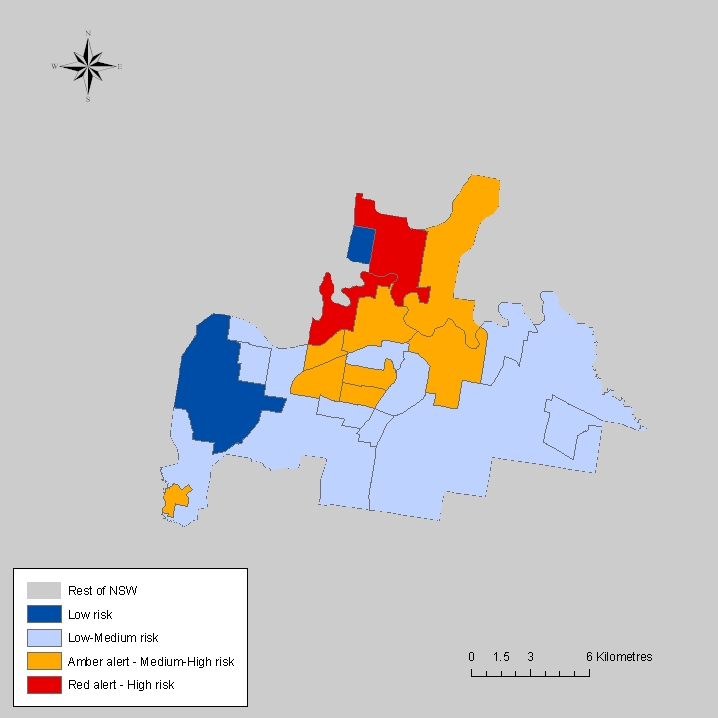
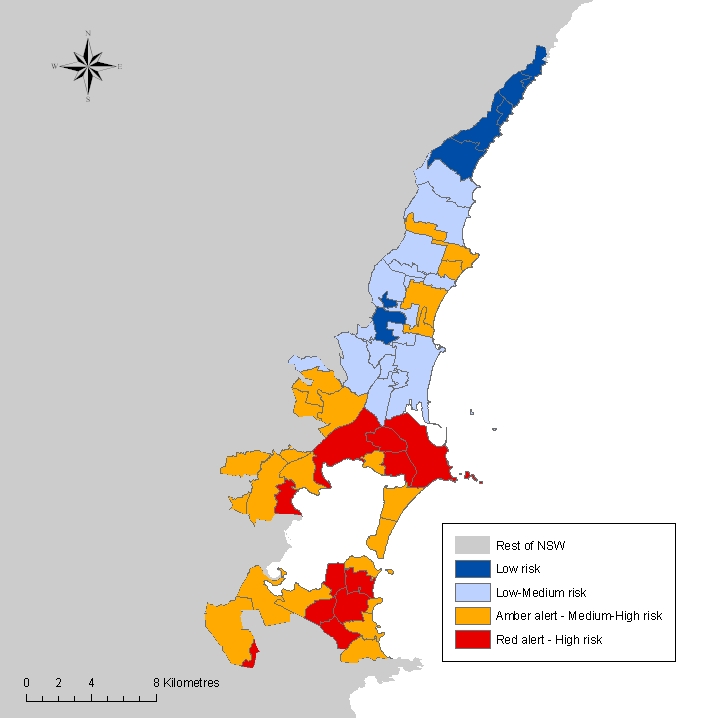
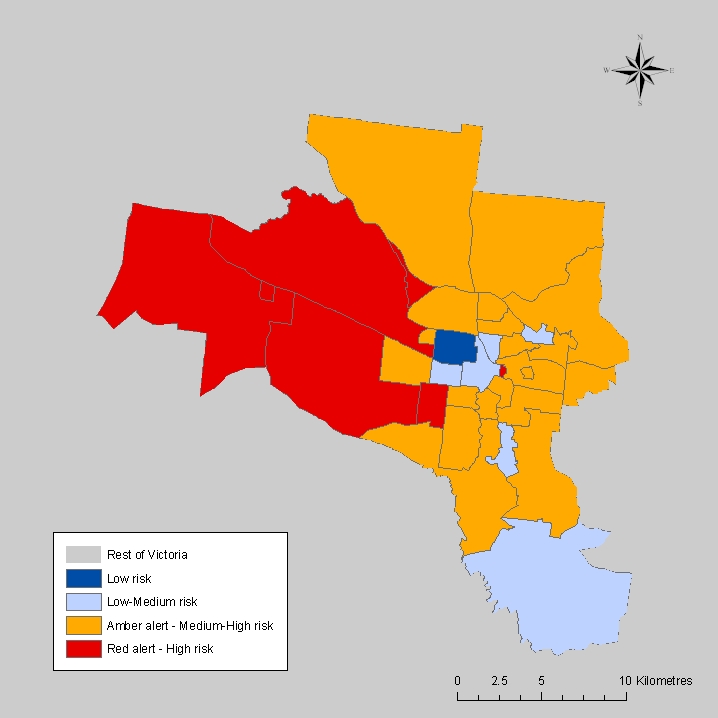
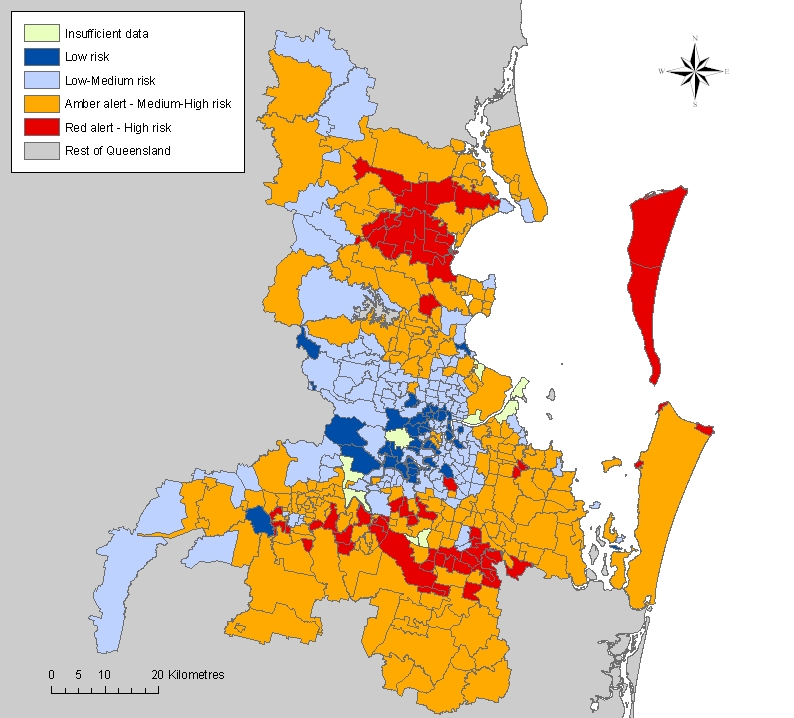
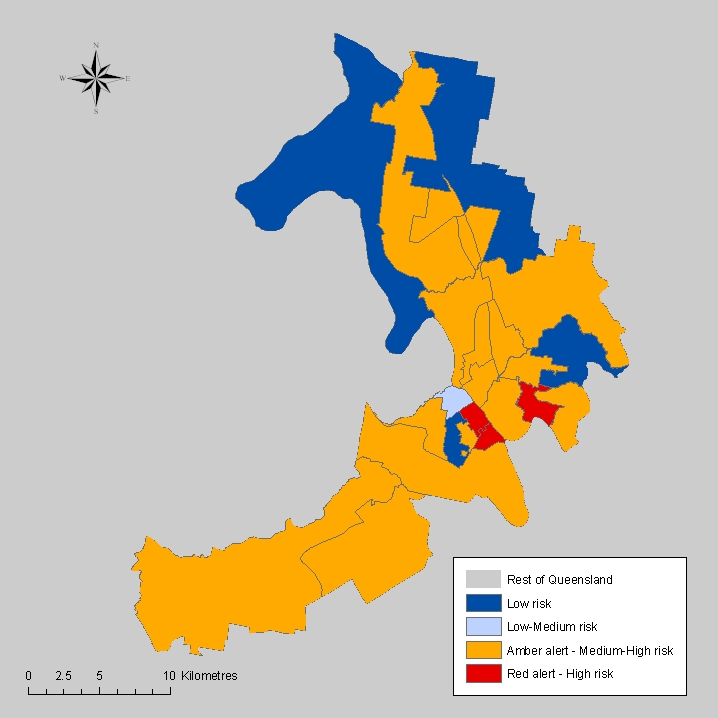
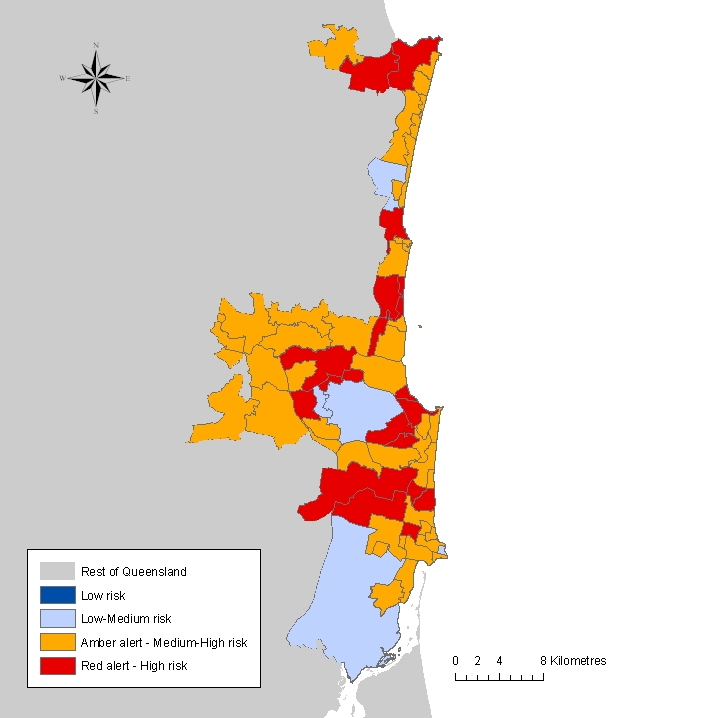
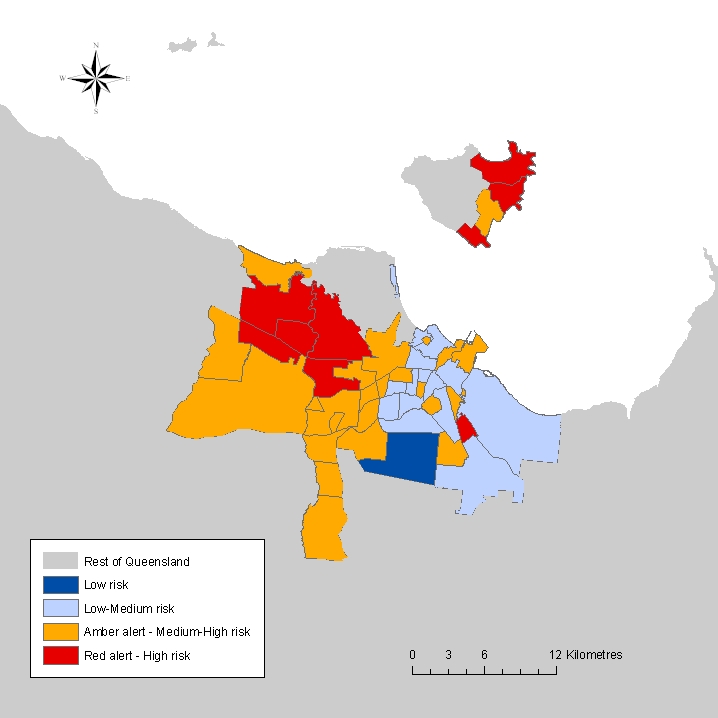
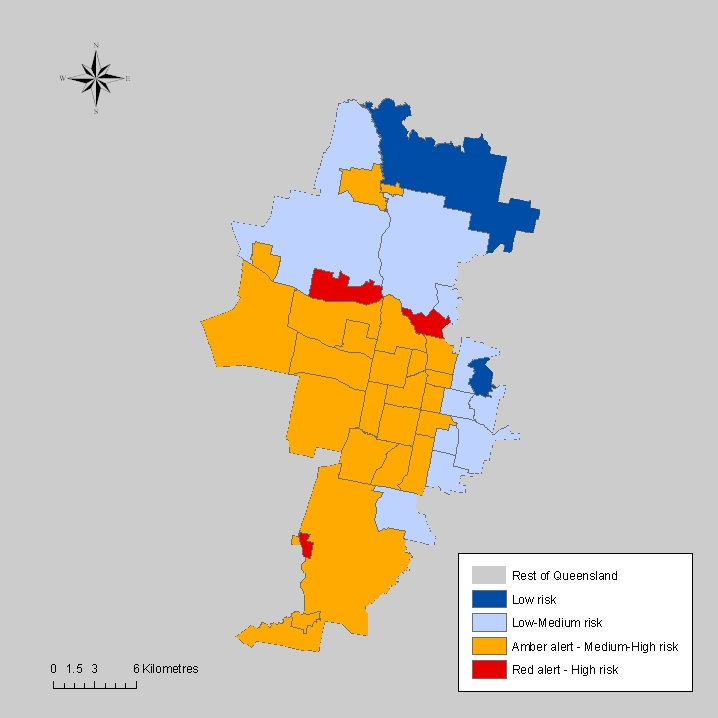
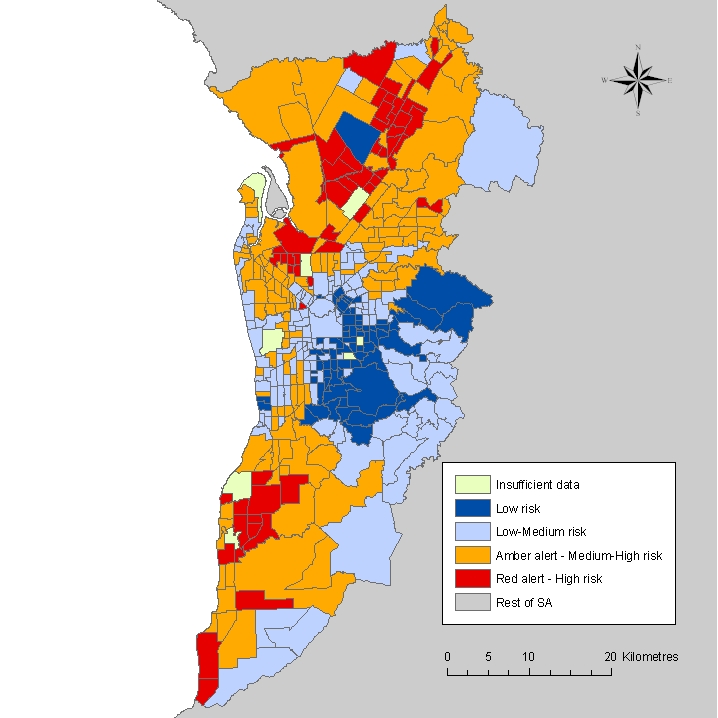
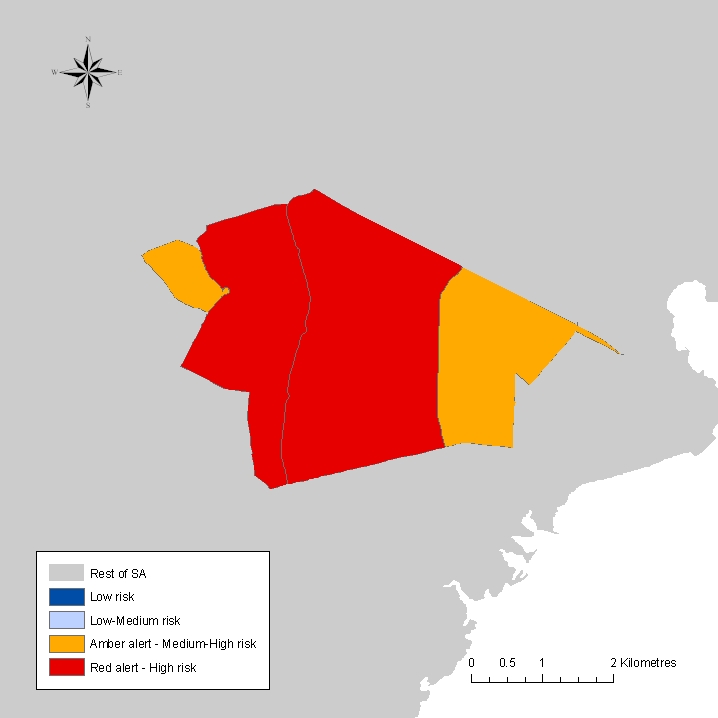
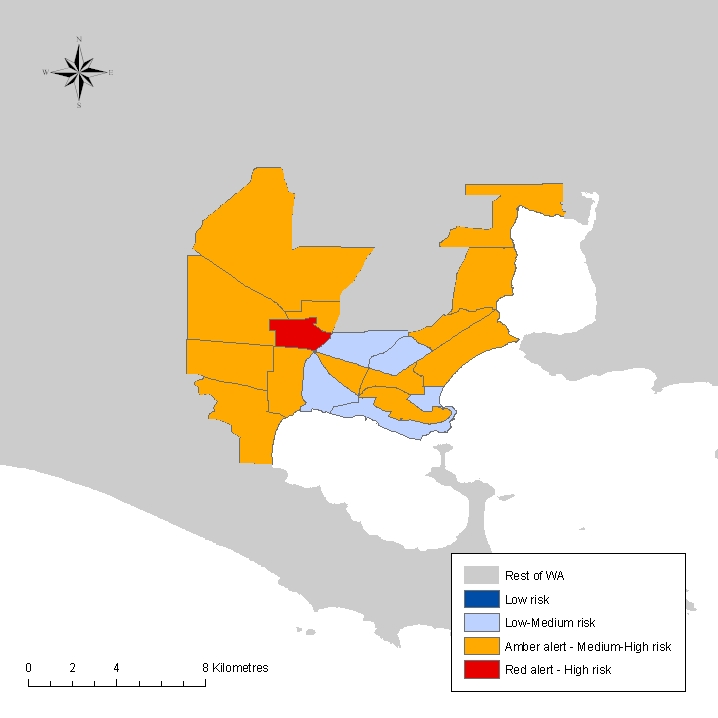
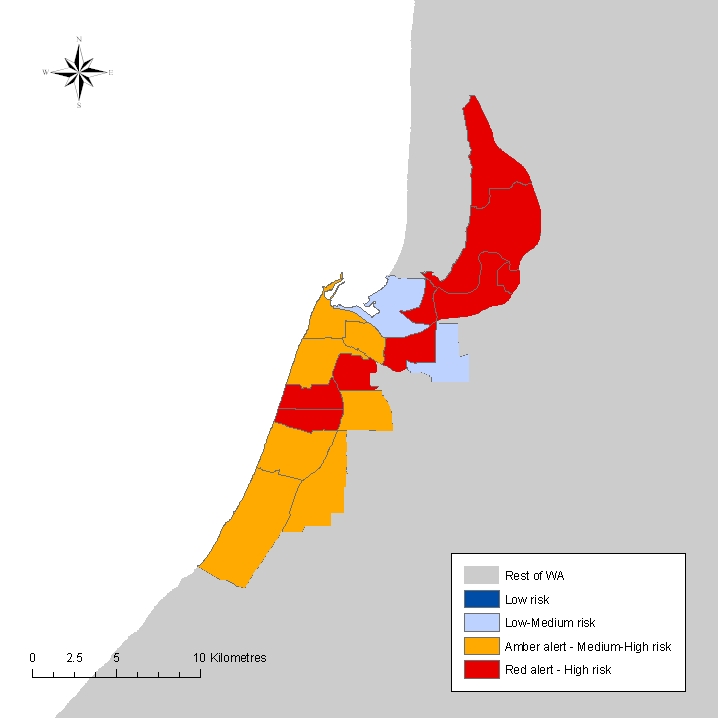
The Employment Vulnerability Index is an indicator that identifies the medium-sized areas that have higher proportions of the types of jobs thought to be most at risk when economic activity declines. The construction of the EVI is explained in the EVI Technical Report (see link below).
The Third Edition of the EVI has been calculated using the latest Australian Bureau of Statistics Census of Population and Housing geography with the focus on Statistical Area Level 2 (SA2) areas, which are closely aligned with the old regional classification known as Suburbs. The ABS define the SA2s as "a general-purpose medium-sized area built from whole SA1s. Their aim is to represent a community that interacts together socially and economically".
EVI 3.0 thus maintains continuity with EVI 2.0, which was released in 2011 but was based on the 2011 Census data. The First Edition of the EVI (EVI 1.0) was calculated using the 2006 Australian Bureau of Statistics Census of Population and Housing geography with the Suburb as the unit of focus. It was released to coincide with the onset of the Global Financial Crisis. We also recomputed EVI 1.0 at the time for the SA2 geographic boundaries to allow us to track changes since 2006.
As a result of the Coronavirus pandemic instigating a new economic cycle, we have updated the analysis using the 2016 Census data and SA2 regions to help us understand where the downturn will have the most severe regional impacts.
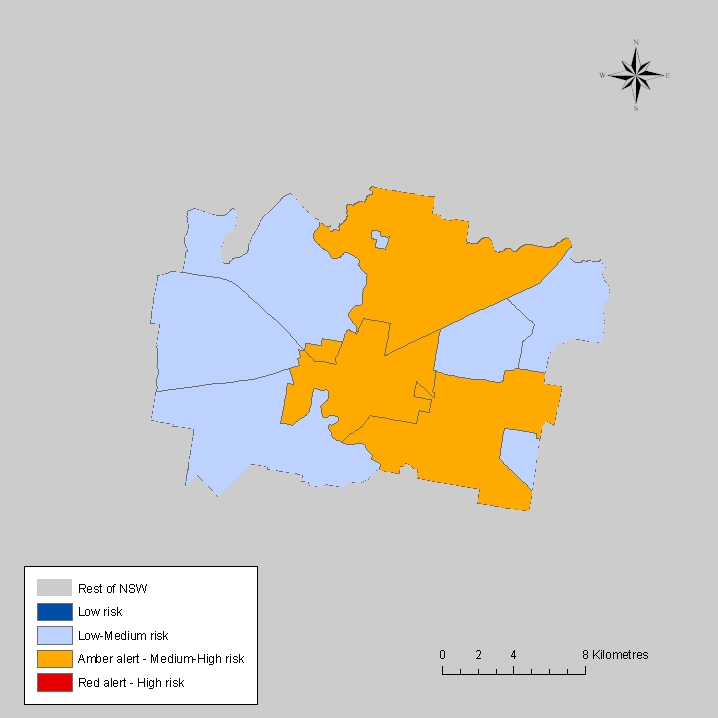
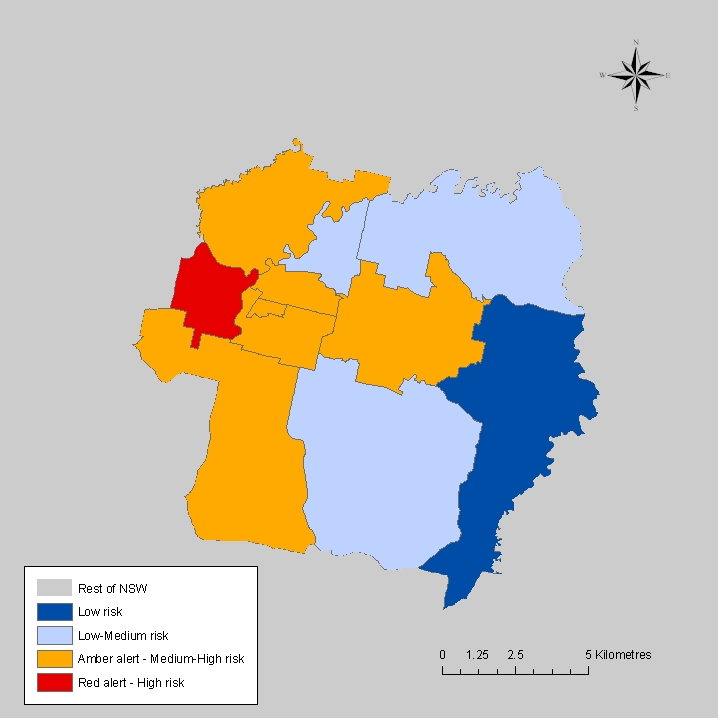
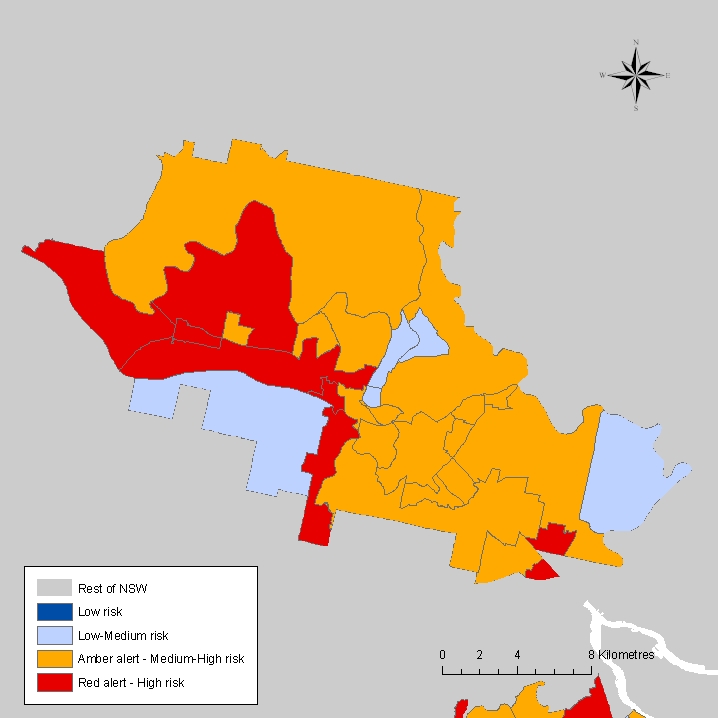
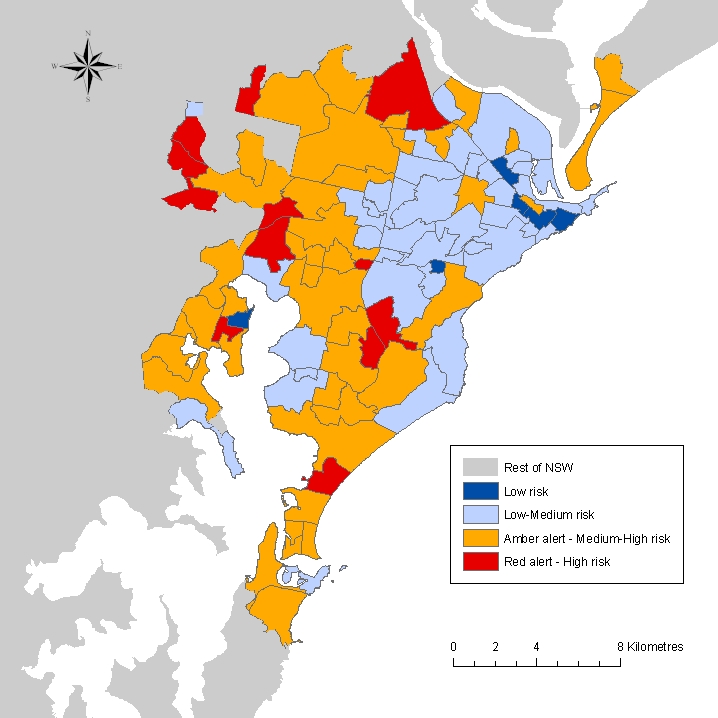
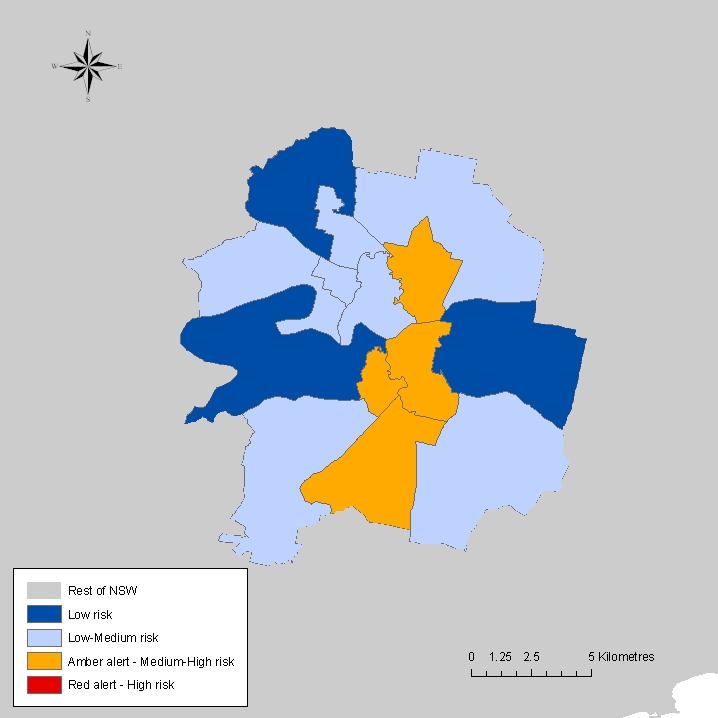
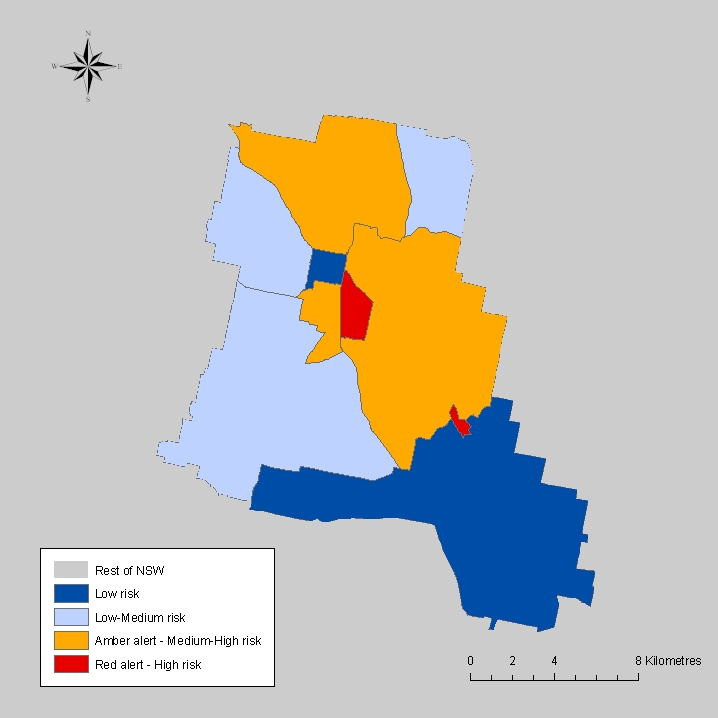
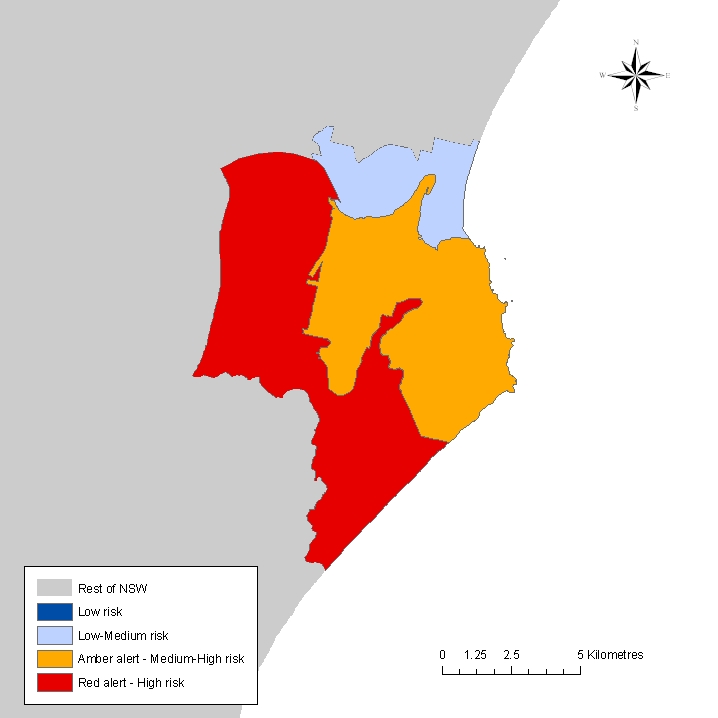
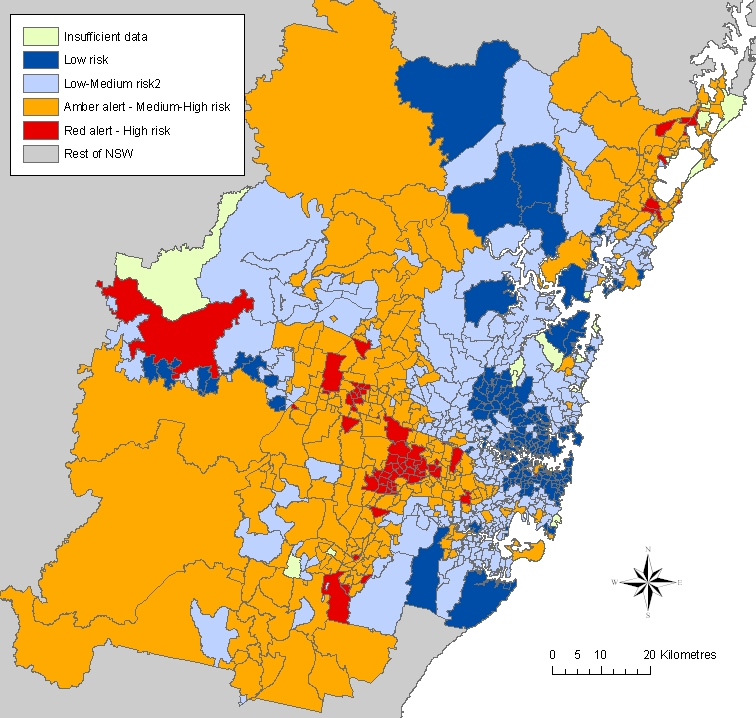
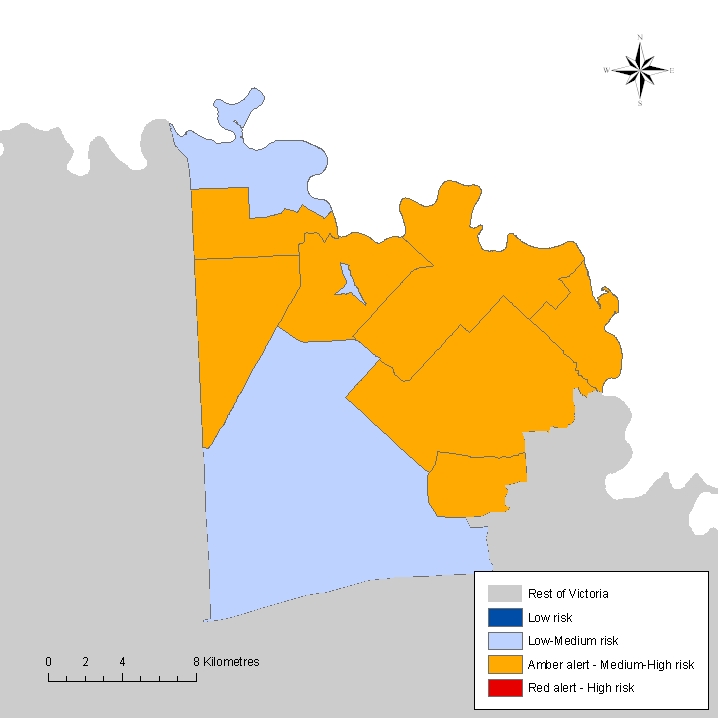
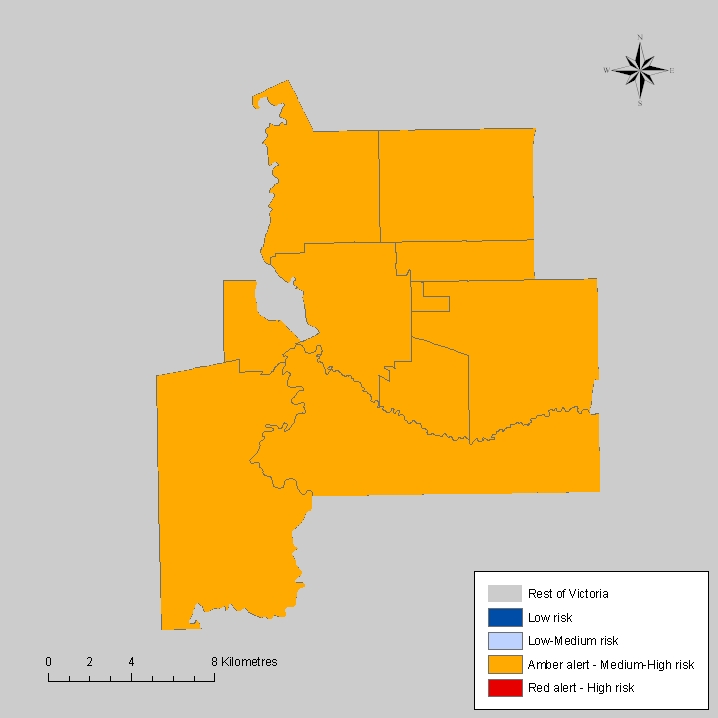
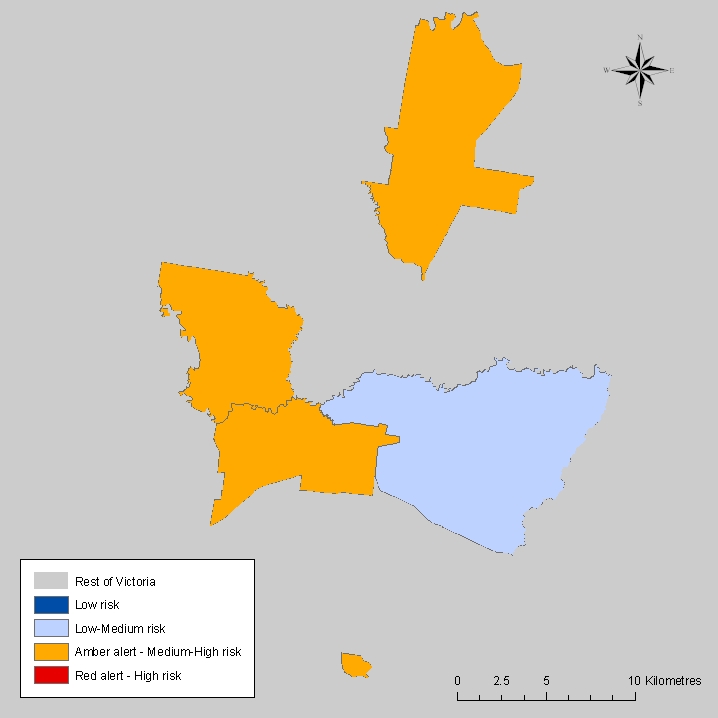
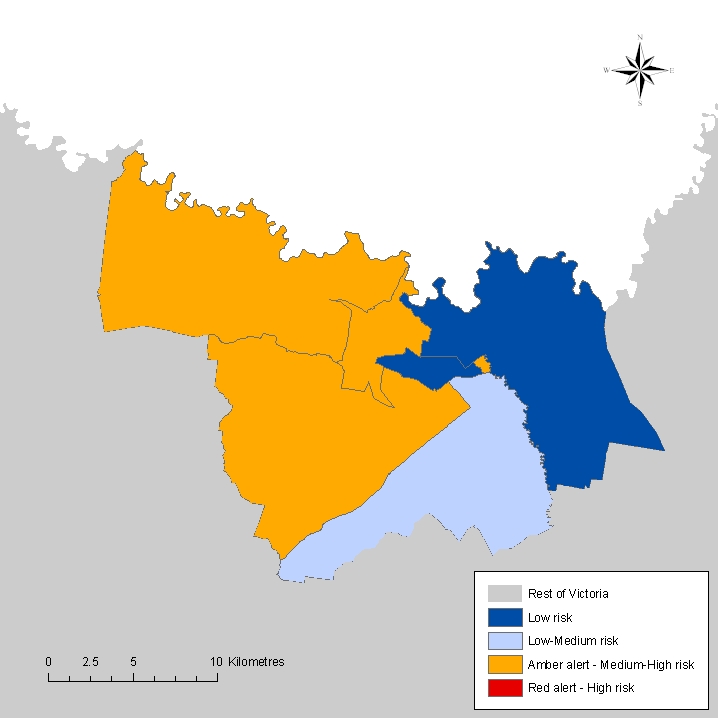
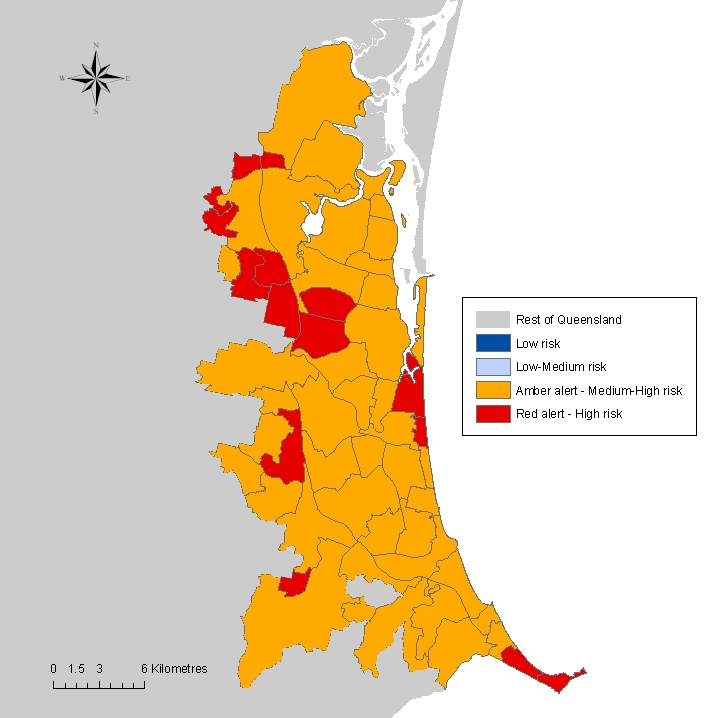
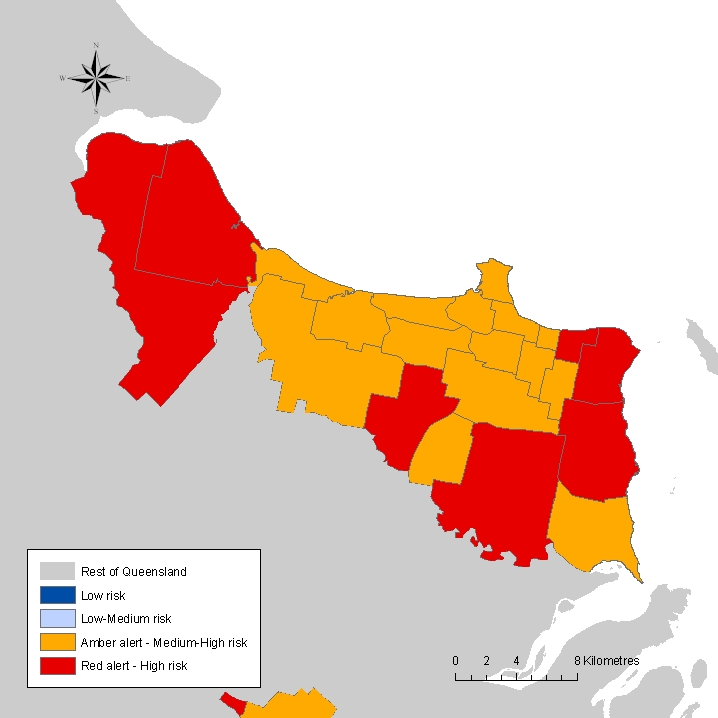
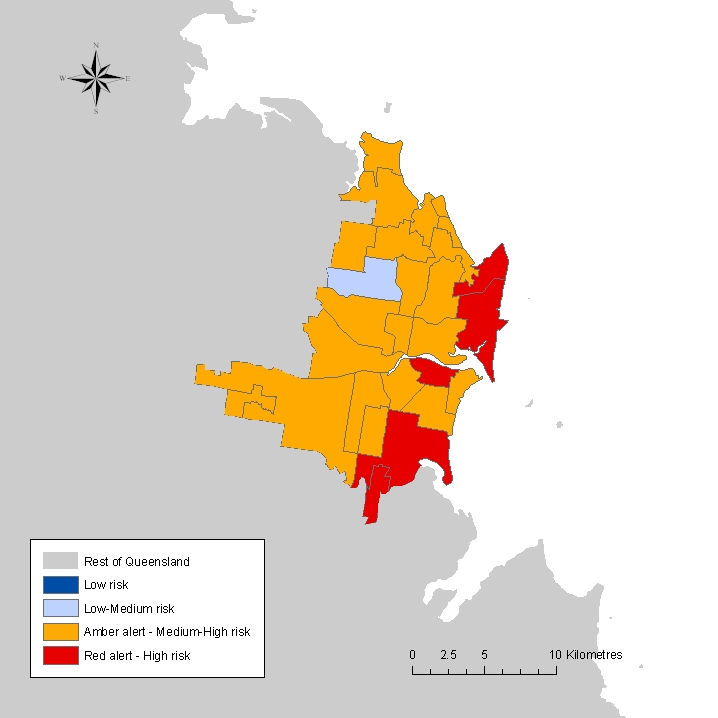
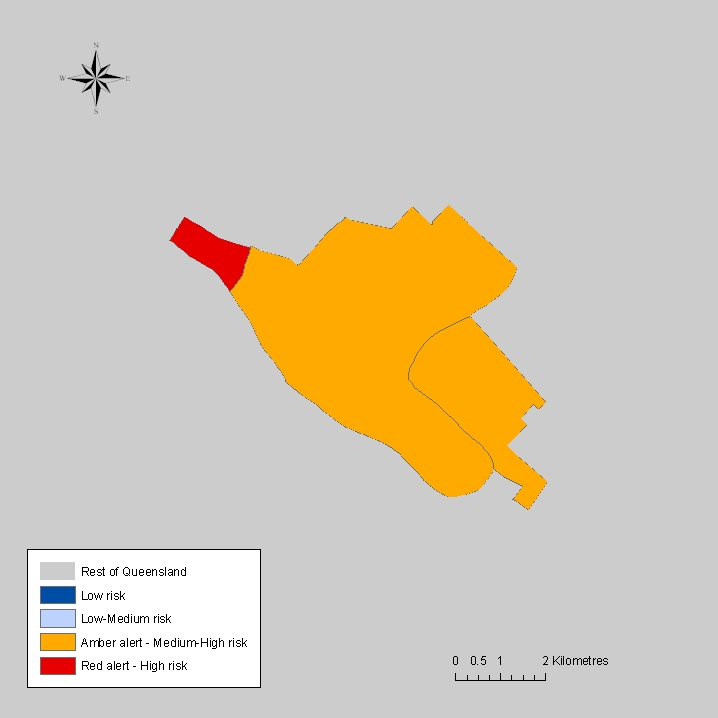
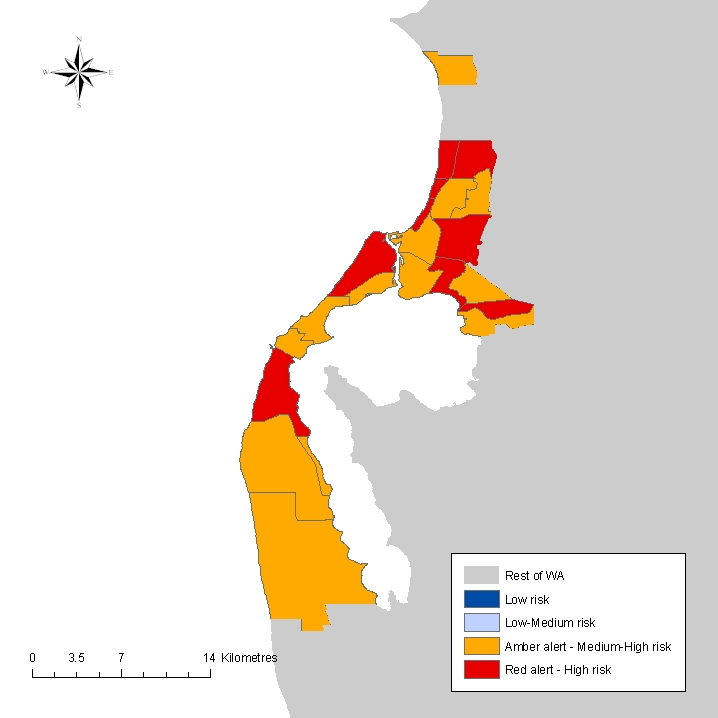
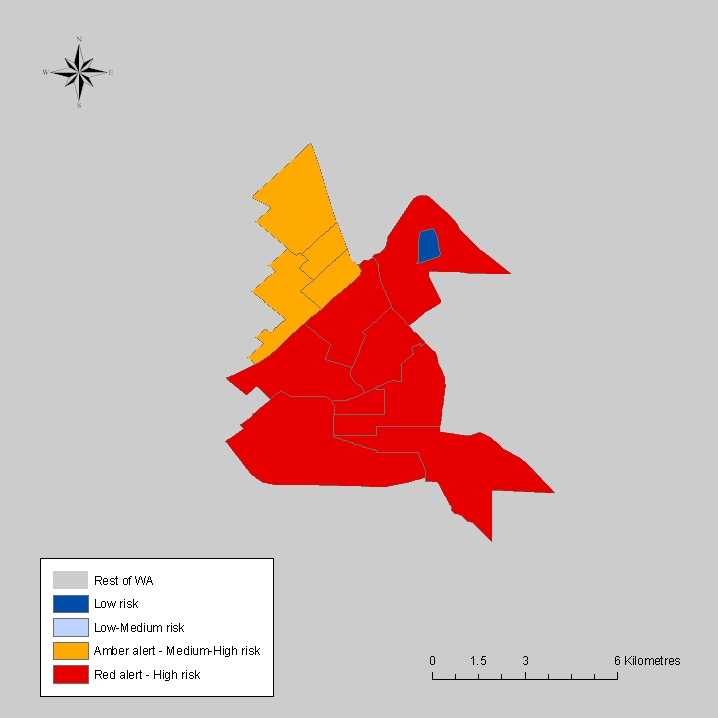
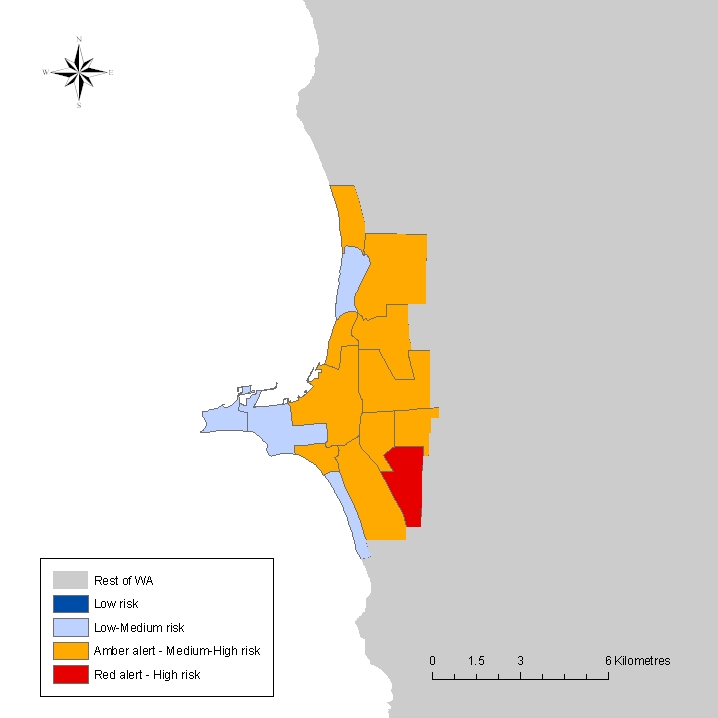
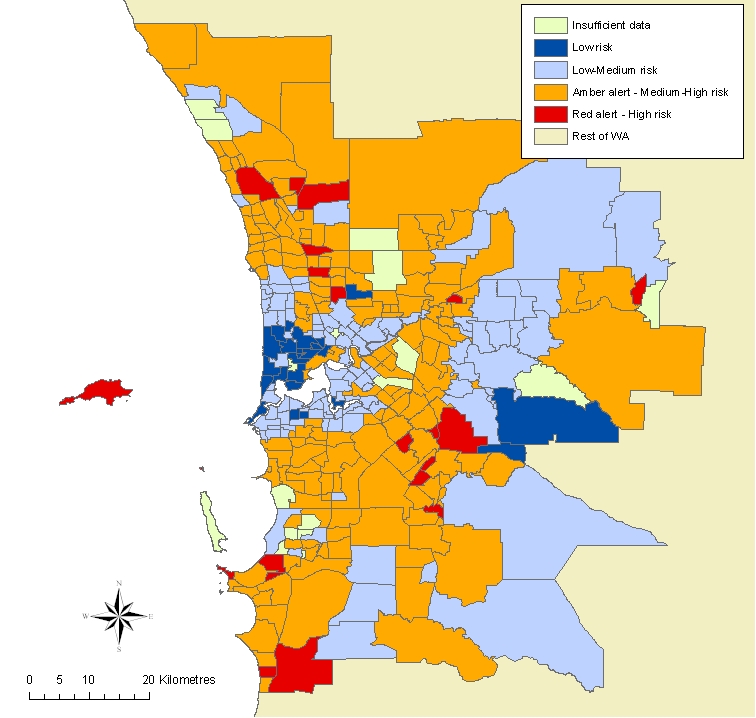
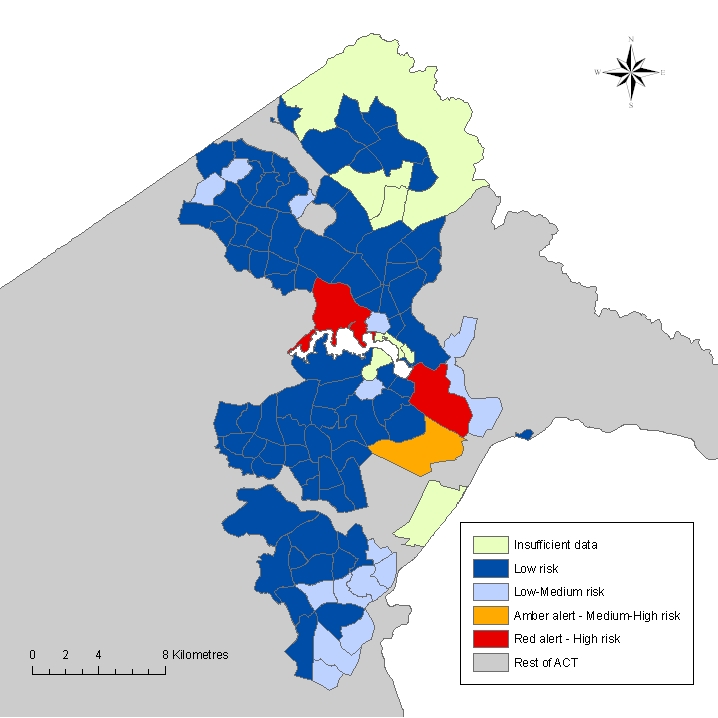
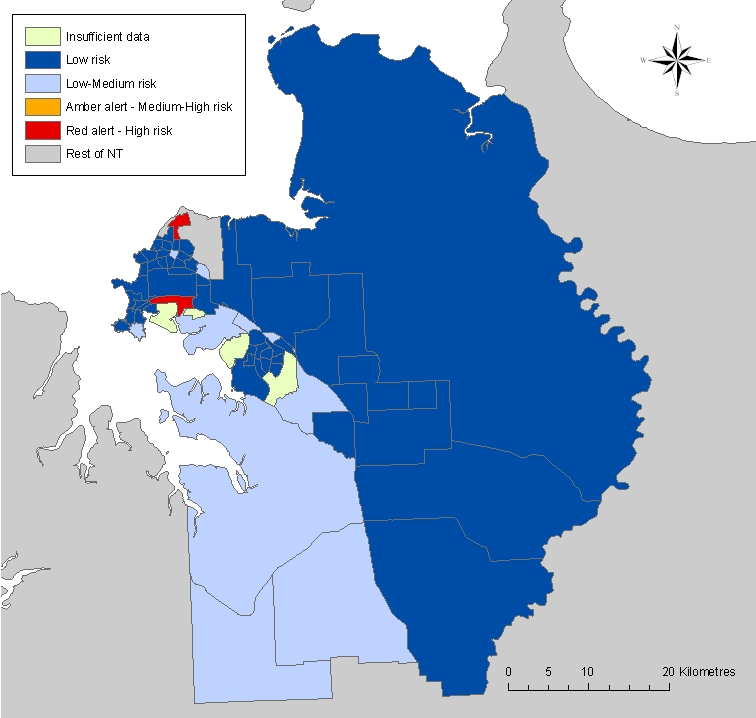
The EVI divides SA2s into four categories depending on its EVI score:
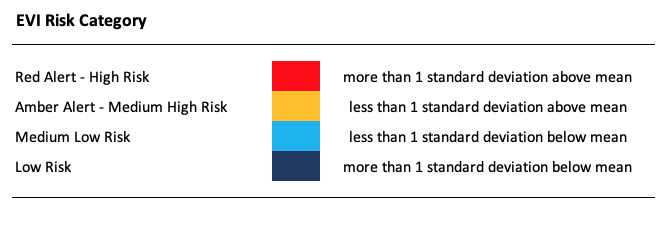
It should be noted that the underlying modelling used to compute the EVI takes into account both suburb and individual characteristics. As a result, any one person in a Red Alert area may have little risk of job loss while any one person in a Low risk area might, in fact, be very vulnerable to job loss. But in aggregate, we would expect the job losses to fall predominantly in the Red and Amber alert areas.
EVI 3.0 was computed using the 2016 Australian Bureau of Statistics Census of Population and Housing data.
It uses the ABS Statistical Area Level 2 (SA2) as the spatial unit of analysis.
EVI 3.0 is calculated for all SA2s that comprise the 101 Significant Urban Areas (SUAs) as defined by the ABS. These are areas that have "significant towns and cities of 10,000 people or more." Together they account for around 88 per cent of the total population in Australia.
Within the SUAs geography, we have constructed detailed profiles to enhance understanding of the EVI 3.0 Index Score.
The Mapping Tool provides a fully searchable map to explore the EVI for all localities included. The maps are presented for Australia as a whole (but the layering is very slow). To speed up the map layers, we also provide State/Territory breakdowns
Select the map you desire
Please select a city that you are interested in and choose the way you want the data ordered in the table that is generated. All the suburbs in the city you select will then be displayed.
| Choose city | |
| Choose ordering | |
EVI 3.0 Final Report - includes an explanation of the methodology used to calculate the EVI, commentary and the major policy recommendations.
Press Package (released April 28, 2020)
EVI 2.0 was computed using the 2011 Australian Bureau of Statistics Census of Population and Housing data.
It uses the new Statistical Area Level 2 (SA2) as the spatial unit of analysis. The 2011 EVI is calculated for all SA2s that comprise the 101 Significant Urban Areas (SUAs) as defined by the ABS.
Please select a city that you are interested in and choose the way you want the data ordered in the table that is generated. All the suburbs in the city you select will then be displayed.
| Please choose the city | |
| Please choose the ordering | |
NSW
Victoria
QLD
SA
Western Australia
TAS
Territories
You can download the Final EVI Report which includes an explanation of the methodology used to calculate the EVI, commentary and the major policy recommendations.
Download the EVI Press Package 2013 - which provides a simple introduction to the EVI and a full list of Red Alert localities for Metropolitan and Non-Metropolitan regions and breaks the list into existing and emerging disadvantage localities.
The First Edition of the EVI was designed using the 2006 Australian Bureau of Statistics Census of Population and Housing Data.
It was computed for Capital Cities (2593 metropolitan suburbs) and the suburbs located in the Australian Bureau of Statistics non-Metropolitan regional centres with more than 20,000 residents. In some cases this does not include suburbs in outer areas of regional cities as they are not included as part of the ABS.s urban centre categorisation.
The results cover over 75 per cent of the total Australian population which reflect the high degree of urbanisation in Australia.
You can download the Final EVI Report which includes an explanation of the methodology used to calculate the EVI; city by city commentary; tables, maps and statistics; and the major policy recommendations.
Please select a city that you are interested in and choose the way you want the data ordered in the table that is generated. All the suburbs in the city you select will then be displayed.
| Please choose the city | |
| Please choose the ordering | |
G15V 162 Albert Street
East Melbourne 3002 Victoria
Australia
© Centre of Full Employment and Equity 2026
Telephone: +61-(0)419 422 410
E-mail Bill.Mitchell@newcastle.edu.au
![]()
